Five Momentum Investment Models

As mentioned in a previous post, I have created several momentum investment models. Five, in fact. One for each of my investment accounts. (You may want to start at the previous post to get some perspective before venturing on here.) Some of my accounts are large and some are small. And each investment account has its purpose. I’ve already introduced you to PUSH THE BUTTON MAX in a previous post, so let me introduce you to the other four, each of which has its own personality.

BLASTER

BLASTER is the most aggressive of my models. It might be more appropriate for a smaller account, or for a young, aggressive investor. From 2007 thru May 17, 2021, BLASTER had an average annual return of 19.2%, vs. the S&P 500 return (as represented by the ETF SPY) of 9.9%. The maximum drawdown was -19.6% vs. -55.2% for SPY. Here are the particulars of the backtest, as reported by ETFReplay.com.

BLASTER – Risk and Returns

BLASTER definitely has a unique personality. When the model is bullish, it invests in just one ETF from a portfolio of 25 rather aggressive ETFs (see below). The heart of this portfolio is technology, with a broad mix of additional ETFs in green energy, oil & gas exploration, home construction, financial services, etc. I love BLASTER for its aggressiveness. Even though I’m an old guy, I really like having some small part of my assets in these very aggressive ETFs.

BLASTER – Portfolio

So how did BLASTER perform each year? Following is the ETFReplay.com backtest annual results.

BLASTER – Annual Returns

SMOOTH

SMOOTH is a big contrast from BLASTER. SMOOTH gives a much more gentle ride. Notice below, the worst period (monthly) loss from 2007 thru May 17, 2021 was only -6.58%. SMOOTH gives up the aggressive upside potential that you get with BLASTER for a much gentler ride. I use smooth for one of my larger accounts. It helps me sleep well at night.

SMOOTH – Risk & Returns

SMOOTH enjoys a quiet ride because, when the model is bullish, it invests in three ETFs (vs. one for BLASTER) and its core is centered on dividend-paying ETFs (see below). The cashflow produced by these dividend-paying ETFs tends to smooth out the volatility. In addition to dividend-paying ETFs, the model can choose from ETFs that focus on various company sizes and growth prospects. And finally, there is the option to select ETFs focused on companies in foreign countries.

SMOOTH – Portfolio

So what do the annual returns of SMOOTH look like? Let’s look below.

SMOOTH – Annual Returns

ROBUST

Introducing ROBUST, the big daddy. I use ROBUST for my largest account. ROBUST backtests an average annual return of 16.3% from 2007 through May 17, 2021, with a drawdown of only -13.9% during that period (see below).

ROBUST – Risk & Returns

ROBUST takes a bit more work to manage since it chooses the six strongest ETFs from the portfolio each month. That means on the first trading day of the month I might have to close six positions and open six more. But I love ROBUST. It has very large shoulders and long arms to wrap itself around the entire marketplace. What do I mean? Well, the portfolio is not concentrated on any aspect of the market like the other portfolios (e.g., Technology for BLASTER and Dividends for SMOOTH). ROBUST can choose from the six strongest sectors of the economy — a very broad set of options (see below).

ROBUST – Portfolio

ROBUST has given a strong performance in the backtest as seen below.

ROBUST – Annual Returns

SLICK

SLICK (Don’t you love these names?) is the final model, which I use for a small account. The average annual growth rate for SLICK (from 2007 through May 17, 2021) was 16.9% with a maximum drawdown of -15.6%, according to ETFReplay.com. Like BLASTER, SLICK chooses just one ETF each month. That kind of concentration can result in big up months (best period of +18.52) and down months (worst period of -10.10%). Imagine seeing your account go down over 10% in a month. That’s why I use it on one of my small accounts.

SLICK – Risk & Returns

For small accounts, being able to simply trade in and out of one ETF each month make life easy-peasy. SLICK chooses from ETFs that tend to take their turn at accelerating in bull markets (see below). SLICK selects from ETFs that are very similar to PUSH THE BUTTON MAX, but takes it a step further in aggressiveness by limiting the choice to just one ETF.

SLICK – Portfolio

And the results look pretty good on an annual return basis, as shown below.

SLICK – Annual Returns

Summary

So there you have it. Five momentum investment models, each with a unique personality. I’m not recommending these models. I’m just telling you what I’m using right now for our investment accounts. More than likely, I may be on to some other system or methodology in a few weeks, months or years. But for today I’m really enjoying these models. There is peace of mind knowing how they behaved since 2007. I hope these models give you some new ideas for your investments.

May the returns be ever in your favor! — Clay

Advertisement

How I Invest (Update)

There are unlimited ways to skin the cat (invest). And when one door closes, several others open wide. Since my last post on investing where I described my investment strategy using dividend producing assets, doors have been closing on these high yield investments. First, we had a major market correction from Covid in the Spring of 2020. Many high yield assets took it on the chin, and a significant number of them had to reduce their dividends. Today those same assets have some of the lowest yields in history. Essentially providing the investor with no reward for the added risk of these lower quality assets (see Mark J. Grant’s excellent report here).

As the events above developed in early 2020 I began to earnestly look for the next door to open. (Sometimes investing feels like jumping from hot rock to hot rock.) Enter door number three, momentum investing.

Momentum Investing. The concept of momentum investing is to identify which group of securities are appreciating faster than all others and simply jump in and hang on for the ride. The concept is similar to one of Newton’s Laws of Physics – an object in motion tends to stay in motion …. Or, you can liken it to rafting down a river. You look for the center of the river where it flows the fastest, get there and hang on. This is momentum investing.

Years ago (maybe 10 years?) I experimented with ETFReplay.com. So as I was checking doors for a new investment plan in 2020 I revisited this site and was pleased to see that it had become far more advanced and useful. After building and testing several different momentum models, I settled on a Regime Relative Strength model that has given me some exceptional returns.

Backtesting. With ETF Replay you can backtest your model to see how your investments would have behaved in previous bull and bear markets. If you don’t like what you see, you modify the model and backtest again (rinse and repeat). This is extremely helpful. Although past performance does not guarantee similar results in the future, looking at the past performance of your model can give you a feel for what to expect (or at least hope for) in the future.

ETFs. As the name implies, ETF Replay is focused primarily on ETFs (exchange-traded funds). An ETF is a basket of securities. For example, the ETF KBE is a basket of bank stocks.

I prefer trading in ETFs over individual stocks. Why? Each stock represents an individual public company, and that company must report on its earnings every three months. On the day of the earnings announcement the stock price can fall through the floor in an instant. You can lose a lot of wealth in a moment, which was okay when I was younger and could be more aggressive, but I’m an old guy now and I’m living off these investments. So I prefer ETFs, which contain an entire basket of these stocks or securities. If any one of the stocks in an ETF has a dramatic price drop from an earnings announcement it will hardly move the needle on the price of the ETF. In short, an ETF’s price is typically less volatile than an individual stock’s price.

My Models. So what do my ETF Replay models look like? How do they work? Why am I happy with them? Here is the backtest (below) of one of my models I call “Push the Button Max” (In honor of “The Great Race”).

Hanibal 8 – The Great Race

How do you read this thing (see below)? Well, the green line represents what my portfolio would have done if I had invested $100,000 in 2007. The blue line shows that same investment in the S&P 500 ETF (SPY), which represents the 500 largest companies in the United States (and is commonly used as a benchmark for the entire stock market). So this backtest is comparing the performance of my model portfolio to the general stock market, as represented by the ETF SPY.

At the right (above), you can see the total return for my model was over 700% since 2007, whereas the benchmark (S&P 500) returned 265%. (Any time you can beat the benchmark return, it’s a good thing. And this model crushes it.) Now look at the Summary Statistics. In addition to beating the benchmark’s compound annual growth rate (CAGR) 15.9% to 9.6%, the maximum drawdown for the model is only 14.7%, versus a 55.2% drawdown for the S&P 500. In other words, if you kept your investments in the top 500 U.S. companies since 2007, you would have lost over 55% at one point during that time (maximum drawdown). Whereas your biggest drawdown (one-time-loss) using the benchmark would have been only 14.7%.

As you review the backtest of a model, one of the things you do is to try to imagine the emotion of your winners and, most importantly, your losers. The big question you ask yourself is, can I emotionally sustain that kind of loss for the year or for the month. So let’s start by looking at the annual returns (see below). 2008 was the year of the big crash. That year the S&P 500 (as represented by the benchmark — SPY) was down 36.8% Ouch! But our model switched to a bearish regime and we were actually up that year 13.1%. Whew! And the next year, our model was up 50.4%! (This model does extremely well in the aftermath of a market crash.)

So what were the worst years for our model? In 2010 the model returned only 1% while the market (SPY) returned 15.1%. Ouch! And during 2015 the model lost 4.2% while the market was up 1.3%. Double-ouch! These backtests are very valuable as we look at each year and consider whether we could patiently hold on during the mediocre years while we wait for the years of big gains.

Now let’s look at some monthly returns (below). Here we see the model starts Jan 2007 in the bullish regime (I’ll talk about the model’s bullish and bearish regimes later.) and was invested in KBE (banks) and XLY (consumer discretionary) ETFs. During that month the model outperformed the market 1.69% to 1.5%. The next month the model lost 2.66%, while the market lost 1.96%. So that is how you read the monthly backtest.

You can see that the model switched to the bearish regime for the month of March 2007 (IEF is a government bond ETF). And during the worst of the market downturn, the model was in the bearish regime most months, from August 2007 through March 2009. During that time it usually made money and it escaped most of the big down months when the market was down 6.05% (Jan 2008), 9.44% (Sep 2008), 16.52% (Oct 2008) and 10.74% (Feb 2009). But it did get clobbered with the market in June 2008. So that’s how you read a backtest and try to visualize how you would handle the emotions of the up and down months and years.

So how does this model work? I simply push the model’s backtest button once each month, the model runs, and it shows me which ETFs are showing the strongest price appreciation. I simply exit last month’s ETFs and buy the model’s new recommendations for the new month. That’s it. I don’t need to spend time doing market research and I don’t need to trade any other time during the month. Using my models I now spend only about 30 minutes each month “investing”.

Okay, but what’s in the guts of the model? How does the model do its magic? Warren Buffett once said, “The first rule of investing is, don’t lose money. The second rule of investing is — don’t forget the first rule.” I love this simple principle and have built my models to protect me from market downturns. The first thing the model does is to determine which “regime” we should be in. If the market is going up, the model switches to a bullish regime (program). If the market is going down, the model switches to a bearish regime. This is how the model was able to escape the 55.2% drawdown that the market experienced, with only a 14.7% drawdown for the model’s investments.

How does the model know when to switch back and forth from bullish to bearish regimes? It uses a combination of long-term and short-term moving averages of both the SPY and IEF ETFs. When the combined moving average of SPY crosses above the combined moving averages of IEF, it switches to the bullish regime. When the opposite happens, it switches to the bearish regime.

Bearish Regime. For the bearish regime the models simply invests in IEF, which is an ETF containing government bonds with a maturity between 7 and 10 years. These bonds tend to go up when the stock market is going down. This is how we protect ourselves from a market downturn.

Bullish Regime. For the bullish regime the models select the top ETFs from a group of ETFs (portfolio). I have several investment accounts and each is set up with its own model designed to pick from a different group of ETFs. This gives me some diversification across my investments. Exactly how does it pick the best ETFs? It compares the ETF returns over a medium-term timeframe, a short-term timeframe and also factors in volatility — and selects the ETFs that are going up in price at the fastest rate, with the least volatility.

Summary. Clear as mud? Well, I do hope this was helpful. These models have been extremely profitable for me in recent months. As mentioned before, they tend to work well after a market crash (like we just experienced due to Covid in 2020). How long will it outperform the market? I have no idea. By the time you read this, I may have moved on to another model, or I might be using a technical or fundamental analysis investment plan. I move from hot rock to hot rock and take what the market is offering at the time. But I hope this gives you some helpful ideas so you can expand your investment arsenal. Happy investing!

How I Invest.

How Do I Invest? What is My Process?

 Recently, a friend asked me to share the process I use to invest my own retirement funds.  If you, too, are curious, or are thinking about becoming a do-it-yourself investor, this post is for you.

Most people who do not have a background in business (I have an MBA) or years of experience investing their own retirement funds (I’ve been investing for almost 40 years) will be better off having their retirements professionally managed.   However, I am a big advocate for taking charge of your own investments, especially for those who are young and have time to recover from their investment mistakes (like I did).

In addition, there are those who are retired, whose income is mainly from a pension, but who have a small portion of their retirement in an IRA and would like to manage that small portion themselves.  That can make a lot of sense.

This post will not be about what to own.  This post is not a recommendation for any particular investment. (Do your own research!)  Rather, this post is about WHERE I go to inform myself, and what tools I use to manage my portfolio.

Fundamental Concepts

First, you must understand that I take a fundamental analysis approach to investing.  Which means I consider the actual business of each company I might invest in; its profit potential, its competitive position vs. its industry, and I formulate a value for that company.  I then buy selected companies when they are “on sale”.

Fundamental analysis is different from technical analysis or momentum analysis.  Technical analysis ignores the business fundamentals and focuses solely upon the historic pricing of the stock.  Technical analysis can be fun, and I use it to a very marginal degree.  Momentum analysis involves seeing “what’s hot” and piling into those securities while they are rising and exiting when they are declining.  Again, this can be fun, but this is not my focus.

Big Picture

I feel it is important to understand where we are in the business cycle. I make my own guesses as to how close we are to the next recession.  This informs my decision as to what types of securities to own in my portfolio.

I also consider where I believe interest rates are likely to go in the future.  Interest rates represent the cost of money.  High interest rates indicate that money is dear and borrowing is costly for businesses.  In a high-rate environment, a business must overcome a much higher hurdle to justify borrowing to grow their business.

I’m a big believer in the concept of ‘reversion to the mean’.   Here is a great example of how I use this principle.

Source: Advisor Perspectives.com

As you can see in the chart above, from a historic perspective, the price investors are willing to pay for companies in the S&P 500 Index are quite inflated, as compared to their historic average.  This graph tells me that stocks are expensive today.  So I must be extremely selective about which stocks I buy in the current environment.  This is also an indicator to me that we are close to a market top and nearing the end of a business cycle.  That’s my opinion.  I look at these and other charts from Advisor Perspective frequently, to keep my perspective on the marketplace.

Source: Advisor Perspectives.com

Here’s another informative snapshot (above).  This single graph gives us volumes of information, but let’s focus on the blue line.  Interest rates, as measured by the 10-year treasury yields, have been in a long-term decline since the early 1980’s.  Currently 10-year treasury yields are just over 2%.  Money is cheap!  How low can yields go?

These two graphs give us the big picture.  But there is an even bigger picture.  What is going on in the rest of the world and how might it affect the U.S. market?

One source I use to stay abreast of world events is Geopolitical Futures.com  (https://geopoliticalfutures.com/welcome-to-geopolitical-futures/).  For a nominal fee I receive daily e-mail briefings on events of the world.  Another source I use is found at SeekingAlpha.com (https://seekingalpha.com), where many gurus of the financial world come together to share their views.  Each guru specializes in their own unique field. Here, for example, is an entertaining and thought provoking author, Mark J. Grant, who purports that we can expect interest rates to continue to decline, even below zero!  (https://seekingalpha.com/author/mark-j-grant#regular_articles)

So these are examples of some of the sources I use to gain a big-picture perspective, which informs my decision-making.  I am constantly looking for additional sources; looking for contrary opinions to my own.  I’m always asking myself, “What if I’m wrong?”  Years of investing experience have taught me to be humble and open-minded to new and contrary ideas.  My methods are constantly changing as a result.  It makes me a safer investor.  And it helps me identify opportunities.

Concepts of Investing

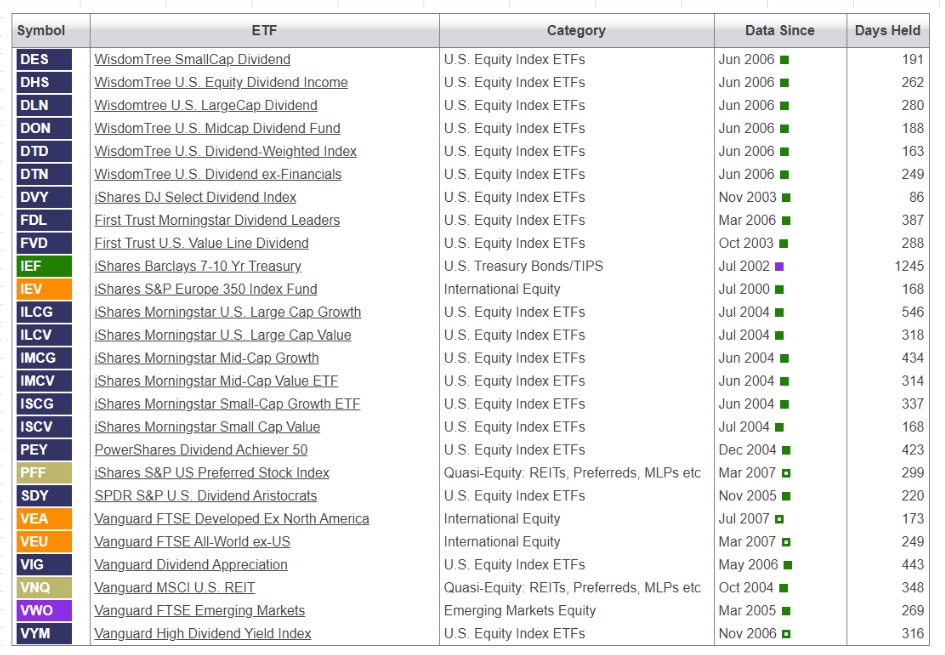
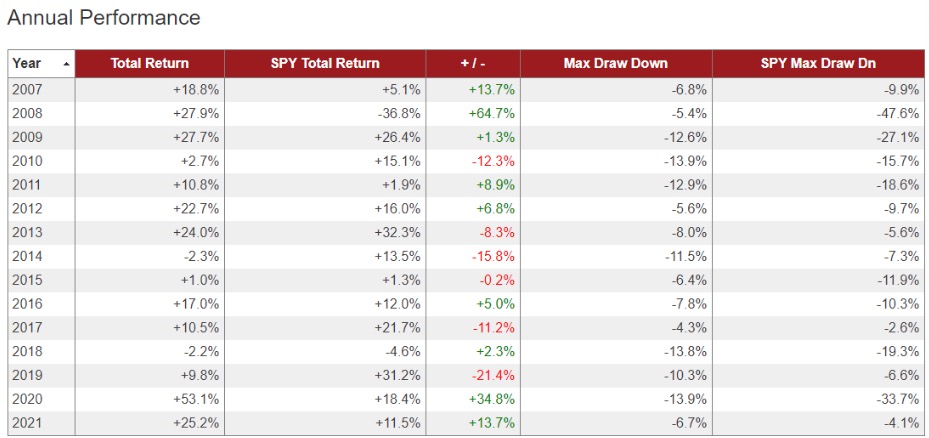
 Portfolio Diversification and Balance.  You have heard the saying, “Don’t put all your eggs in one basket.”  Depending on my age, my financial circumstances, where we are in the business cycle, and current interest rates, I change the mix of assets in my portfolio and how many securities I hold.  As an example, here’s what my portfolio looks like today:

I’m invested in over 60 securities, none of which represents more than 4% of my portfolio.   At some times during the business cycle I have fewer securities and weight the portfolio more toward high-dividend stocks.  But right now I’m looking to reduce my exposure to stocks and increase my exposure to fixed-income securities.  My portfolio is an ever-changing creature based on the factors I listed above.

Each of these asset types must be researched in a different way.  I find it helpful to follow the research done by experts in these various asset types.  My list of experts is constantly changing over the years.  Currently, for equity securities I use two main sources:

Equities.

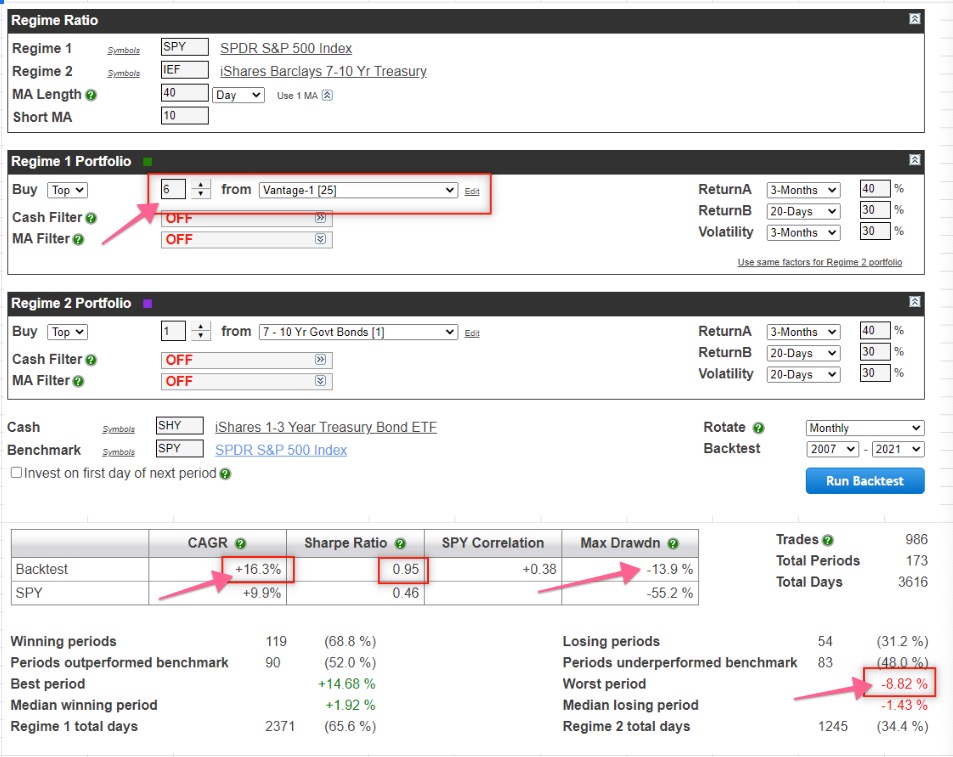
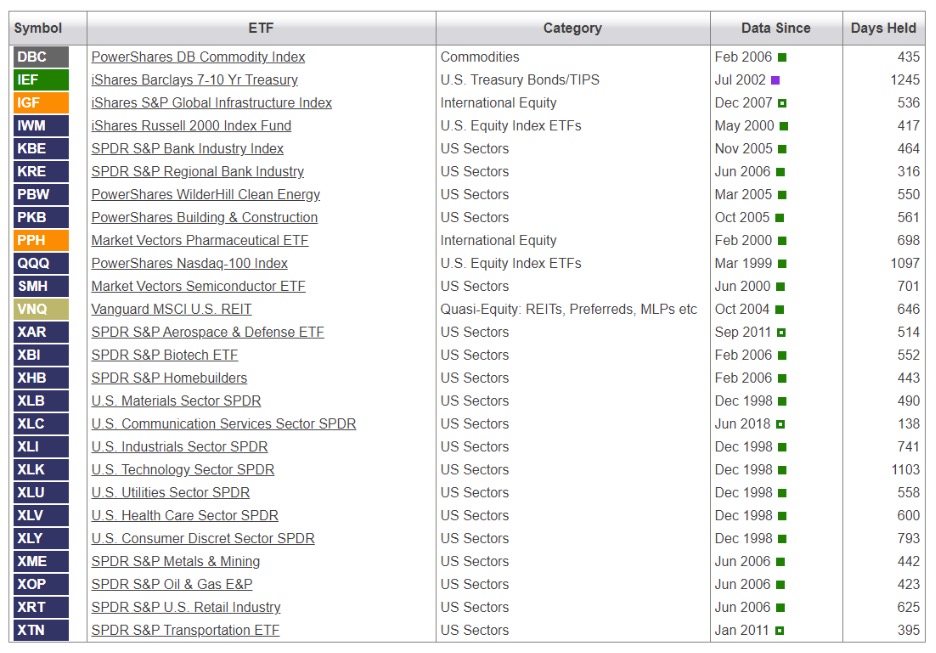
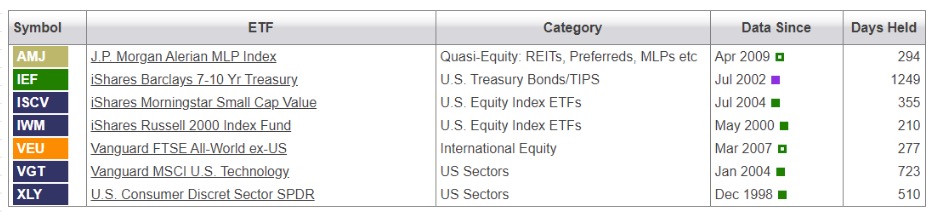
Brian Bollinger produces research on equities, with a focus on measuring the safety each stock’s dividend at https://2.simplysafedividends.com/home.  His service also provides an excellent portfolio management system that allows me to see the big picture of my portfolio, with the ability to drill down to each security for an in-depth analysis.

Here’s a snapshot of a small portion of my portfolio:

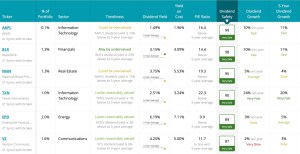
The amount of the dividend and the safety of the dividend are extremely important to me, since I live off the dividends.  This brings me to a concept I follow, which is that — I try to live entirely off the fruit of my portfolio and avoid cutting down the trees.  That is, I don’t sell stocks to fund my living expenses.  Rather, I try to live on less than the income from those stocks’ dividends (and interest from my bonds).

Why does dividend safety matter?  Because, if I’m confident in the safety of the dividend, I can sleep well at night when the price of the stock goes down in a recession.  So long as the company can continue to afford to pay its dividend, I can live my current lifestyle.  Whereas if my strategy were to sell stocks each year to fund my living expenses I would end up destroying the trees that grow the fruit each year (dividend).  Eventually I would have sold all the stocks in my portfolio and would become a pauper. Not good.  So Bollinger’s dividend safety score at Simplysafedividend.com is very helpful to me.

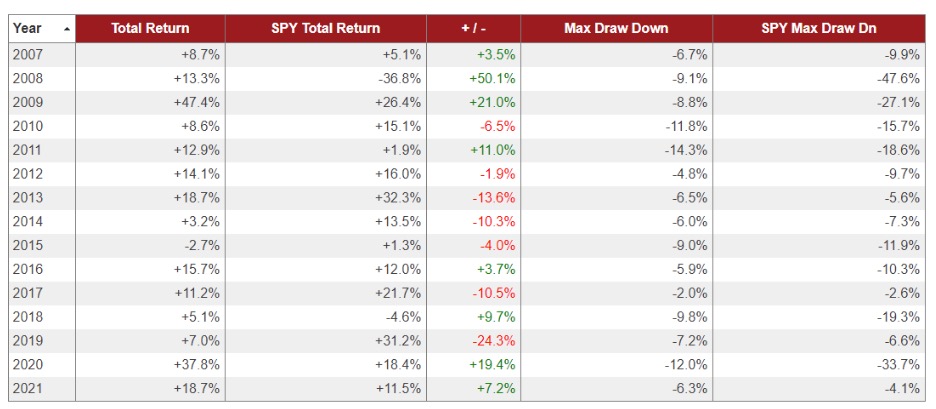
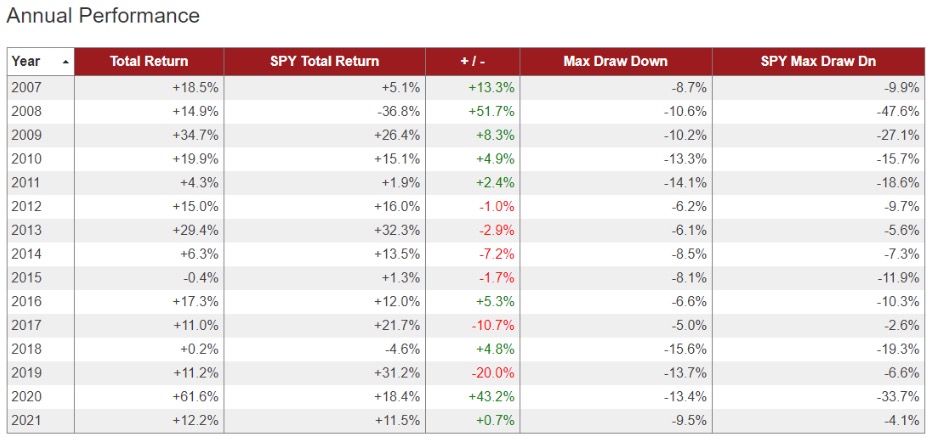
Another source of research I use for selecting equities is found at FastGraphs.com (https://www.fastgraphs.com/trial/).   Here, Charles Carnevale has created an amazingly simple way to view the current value of a company, its dividend history, its forecast earnings, etc.  Here’s a snapshot of one of my holdings using FastGraphs:

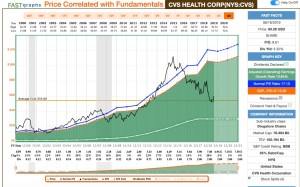
This graph tells a story to those who learn how to read it.

Finding bargains in equities is how I grow the value of my portfolio. But my portfolio income is generated from high-yield equities (utilities, MLPs, REITs, BDCs) and fixed-income securities.

Fixed-Income Securities

If you believe that interest rates will continue to decline (and that’s a big, big question), then fixed-income securities (preferred shares, baby bonds, bonds, closed end funds) become attractive because they not only produce a good yield, but they can also increase in value as interest rates decline.

Again, it really helps to have specialists in these fields ferret out bargains that pop up on occasion.  With their recommendations I can do my own research to pick what I like for my portfolio.

SeekingAlpha.com is a source of two such gurus that send me ideas to consider every week, sometimes every day.  These are Rida Morwa of High Dividend Opportunities, and Stanford Chemist at CEF/ETF Income Laboratory.  I enjoy sorting through their ideas and appreciate their ability to find potential bargains.

Strategy

In my experience, successful investments are typically found where most people are running away from a security.  For example, currently investors are running away from shopping mall REITs (Real Estate Investment Trusts).  Brick and mortar retail sales have suffered from too many malls in the United States. Plus there is the ‘Amazon affect’, a significant growth in on-line sales at the expense of brick and mortar store sales. But not all shopping malls are created equal.

Photo by Heidi Sandstrom. on Unsplash

The highest-quality mall REIT stock prices have suffered along with the low-traffic malls REIT prices.  Hmmm. Are there bargains to be found here?

Another example of potential bargains can be found in correction facility REITs.  These companies build and manage facilities for state and federal prisons.  Recently, while Democratic candidates have been on the campaign trail, there has been much discussion about prison reform.  As a result, investors have run away from correction facility REITs.

Photo by Larry Farr on Unsplash

Hmm. Are the bonds issued by some of these REITs safe?  How likely is it that congress would come together to make significant prison reform? Would they likely release millions of prisoners?  Or would they make some less-dramatic, cosmetic change that would appease liberal voters?  Is there a bargain here?  These are tough judgments that an investor must make in order to find true bargains.

If you want a decent yield and/or a great potential for an increase in your portfolio value, you must find these bargains.  It sometimes feels like running into a burning building while everyone else is running out screaming.

I hope this post has given you a taste of what it’s like to invest for your own retirement.  My methods are unique to me.  There are as many methods of investing as there are investors.  I love to do my own investing and sleuthing to find bargains, while continually staying alert for alligators.  It’s the great game of life for me.  If you want to chat, I am always, always happy to enjoy a conversation about the fascinating adventure of investing.

— Clay