There are unlimited ways to skin the cat (invest). And when one door closes, several others open wide. Since my last post on investing where I described my investment strategy using dividend producing assets, doors have been closing on these high yield investments. First, we had a major market correction from Covid in the Spring of 2020. Many high yield assets took it on the chin, and a significant number of them had to reduce their dividends. Today those same assets have some of the lowest yields in history. Essentially providing the investor with no reward for the added risk of these lower quality assets (see Mark J. Grant’s excellent report here).
As the events above developed in early 2020 I began to earnestly look for the next door to open. (Sometimes investing feels like jumping from hot rock to hot rock.) Enter door number three, momentum investing.
Momentum Investing. The concept of momentum investing is to identify which group of securities are appreciating faster than all others and simply jump in and hang on for the ride. The concept is similar to one of Newton’s Laws of Physics – an object in motion tends to stay in motion …. Or, you can liken it to rafting down a river. You look for the center of the river where it flows the fastest, get there and hang on. This is momentum investing.
Years ago (maybe 10 years?) I experimented with ETFReplay.com. So as I was checking doors for a new investment plan in 2020 I revisited this site and was pleased to see that it had become far more advanced and useful. After building and testing several different momentum models, I settled on a Regime Relative Strength model that has given me some exceptional returns.
Backtesting. With ETF Replay you can backtest your model to see how your investments would have behaved in previous bull and bear markets. If you don’t like what you see, you modify the model and backtest again (rinse and repeat). This is extremely helpful. Although past performance does not guarantee similar results in the future, looking at the past performance of your model can give you a feel for what to expect (or at least hope for) in the future.
ETFs. As the name implies, ETF Replay is focused primarily on ETFs (exchange-traded funds). An ETF is a basket of securities. For example, the ETF KBE is a basket of bank stocks.
I prefer trading in ETFs over individual stocks. Why? Each stock represents an individual public company, and that company must report on its earnings every three months. On the day of the earnings announcement the stock price can fall through the floor in an instant. You can lose a lot of wealth in a moment, which was okay when I was younger and could be more aggressive, but I’m an old guy now and I’m living off these investments. So I prefer ETFs, which contain an entire basket of these stocks or securities. If any one of the stocks in an ETF has a dramatic price drop from an earnings announcement it will hardly move the needle on the price of the ETF. In short, an ETF’s price is typically less volatile than an individual stock’s price.
My Models. So what do my ETF Replay models look like? How do they work? Why am I happy with them? Here is the backtest (below) of one of my models I call “Push the Button Max” (In honor of “The Great Race”).

How do you read this thing (see below)? Well, the green line represents what my portfolio would have done if I had invested $100,000 in 2007. The blue line shows that same investment in the S&P 500 ETF (SPY), which represents the 500 largest companies in the United States (and is commonly used as a benchmark for the entire stock market). So this backtest is comparing the performance of my model portfolio to the general stock market, as represented by the ETF SPY.
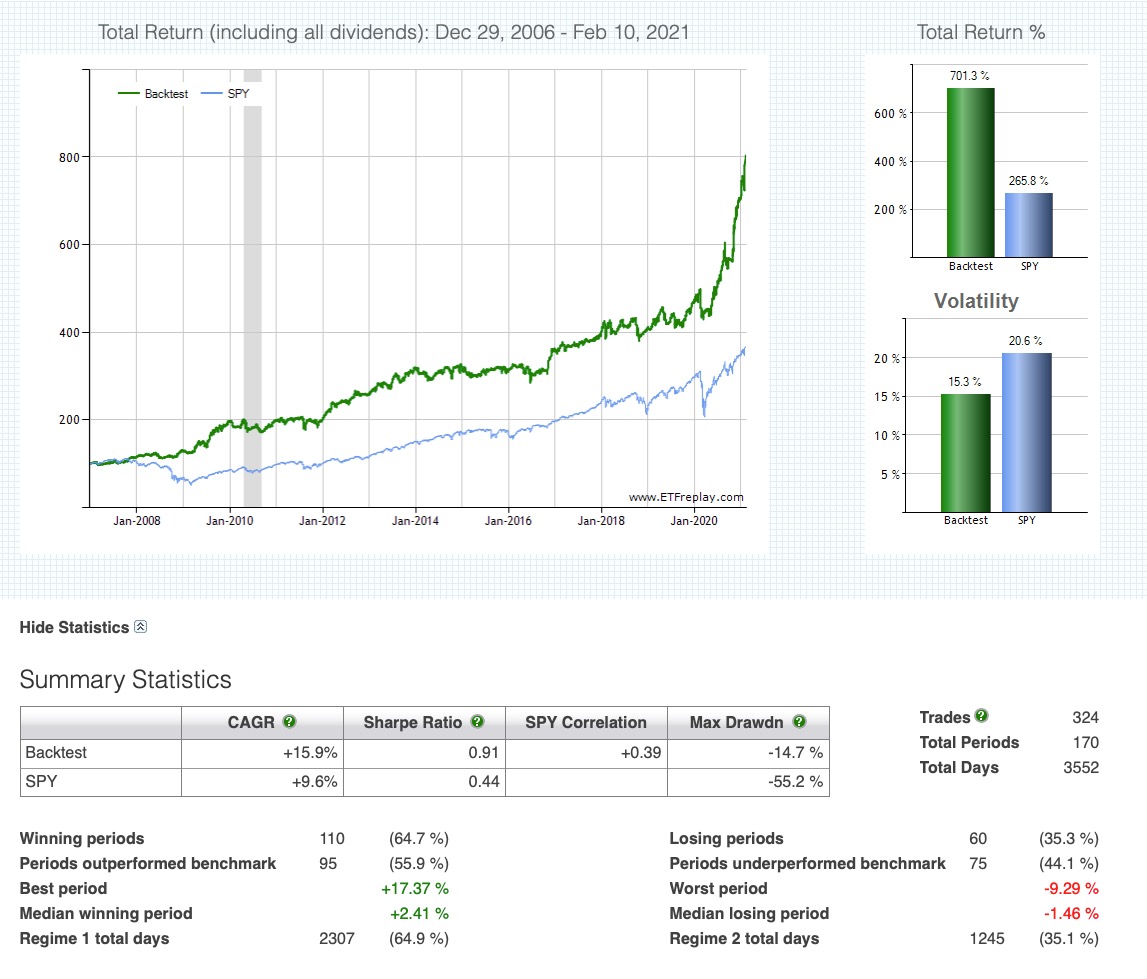
At the right (above), you can see the total return for my model was over 700% since 2007, whereas the benchmark (S&P 500) returned 265%. (Any time you can beat the benchmark return, it’s a good thing. And this model crushes it.) Now look at the Summary Statistics. In addition to beating the benchmark’s compound annual growth rate (CAGR) 15.9% to 9.6%, the maximum drawdown for the model is only 14.7%, versus a 55.2% drawdown for the S&P 500. In other words, if you kept your investments in the top 500 U.S. companies since 2007, you would have lost over 55% at one point during that time (maximum drawdown). Whereas your biggest drawdown (one-time-loss) using the benchmark would have been only 14.7%.
As you review the backtest of a model, one of the things you do is to try to imagine the emotion of your winners and, most importantly, your losers. The big question you ask yourself is, can I emotionally sustain that kind of loss for the year or for the month. So let’s start by looking at the annual returns (see below). 2008 was the year of the big crash. That year the S&P 500 (as represented by the benchmark — SPY) was down 36.8% Ouch! But our model switched to a bearish regime and we were actually up that year 13.1%. Whew! And the next year, our model was up 50.4%! (This model does extremely well in the aftermath of a market crash.)
So what were the worst years for our model? In 2010 the model returned only 1% while the market (SPY) returned 15.1%. Ouch! And during 2015 the model lost 4.2% while the market was up 1.3%. Double-ouch! These backtests are very valuable as we look at each year and consider whether we could patiently hold on during the mediocre years while we wait for the years of big gains.

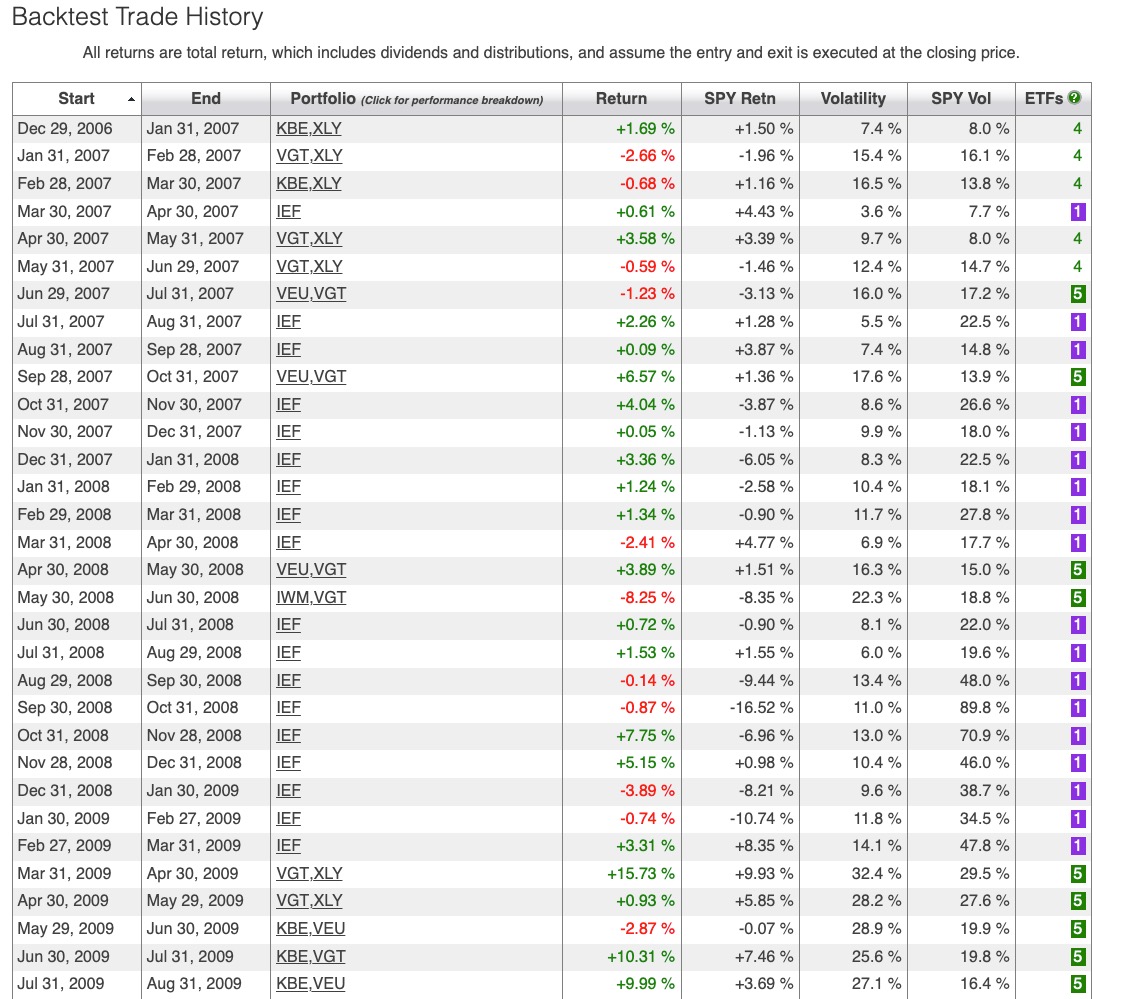
Now let’s look at some monthly returns (below). Here we see the model starts Jan 2007 in the bullish regime (I’ll talk about the model’s bullish and bearish regimes later.) and was invested in KBE (banks) and XLY (consumer discretionary) ETFs. During that month the model outperformed the market 1.69% to 1.5%. The next month the model lost 2.66%, while the market lost 1.96%. So that is how you read the monthly backtest.
You can see that the model switched to the bearish regime for the month of March 2007 (IEF is a government bond ETF). And during the worst of the market downturn, the model was in the bearish regime most months, from August 2007 through March 2009. During that time it usually made money and it escaped most of the big down months when the market was down 6.05% (Jan 2008), 9.44% (Sep 2008), 16.52% (Oct 2008) and 10.74% (Feb 2009). But it did get clobbered with the market in June 2008. So that’s how you read a backtest and try to visualize how you would handle the emotions of the up and down months and years.
So how does this model work? I simply push the model’s backtest button once each month, the model runs, and it shows me which ETFs are showing the strongest price appreciation. I simply exit last month’s ETFs and buy the model’s new recommendations for the new month. That’s it. I don’t need to spend time doing market research and I don’t need to trade any other time during the month. Using my models I now spend only about 30 minutes each month “investing”.
Okay, but what’s in the guts of the model? How does the model do its magic? Warren Buffett once said, “The first rule of investing is, don’t lose money. The second rule of investing is — don’t forget the first rule.” I love this simple principle and have built my models to protect me from market downturns. The first thing the model does is to determine which “regime” we should be in. If the market is going up, the model switches to a bullish regime (program). If the market is going down, the model switches to a bearish regime. This is how the model was able to escape the 55.2% drawdown that the market experienced, with only a 14.7% drawdown for the model’s investments.
How does the model know when to switch back and forth from bullish to bearish regimes? It uses a combination of long-term and short-term moving averages of both the SPY and IEF ETFs. When the combined moving average of SPY crosses above the combined moving averages of IEF, it switches to the bullish regime. When the opposite happens, it switches to the bearish regime.
Bearish Regime. For the bearish regime the models simply invests in IEF, which is an ETF containing government bonds with a maturity between 7 and 10 years. These bonds tend to go up when the stock market is going down. This is how we protect ourselves from a market downturn.
Bullish Regime. For the bullish regime the models select the top ETFs from a group of ETFs (portfolio). I have several investment accounts and each is set up with its own model designed to pick from a different group of ETFs. This gives me some diversification across my investments. Exactly how does it pick the best ETFs? It compares the ETF returns over a medium-term timeframe, a short-term timeframe and also factors in volatility — and selects the ETFs that are going up in price at the fastest rate, with the least volatility.
Summary. Clear as mud? Well, I do hope this was helpful. These models have been extremely profitable for me in recent months. As mentioned before, they tend to work well after a market crash (like we just experienced due to Covid in 2020). How long will it outperform the market? I have no idea. By the time you read this, I may have moved on to another model, or I might be using a technical or fundamental analysis investment plan. I move from hot rock to hot rock and take what the market is offering at the time. But I hope this gives you some helpful ideas so you can expand your investment arsenal. Happy investing!

Thanks Clay!
It’s generous of you to want to share what you know with others.
Sent from my iPhone
LikeLike
Such a comprehensive guide to trading. Thanks for the detailed info!
– Caro
LikeLike
Pingback: Five Momentum Investment Models | Going In Zane